Cathodoluminescence Analysis of Extra-Cellular Matrix
Thanks to its nanometer scale resolution,high-sensitivity and quantitative label-free capabilities, Cathodoluminescence(CL) analyses were performed for the first time in a soft biological derivedtissue. Due to a short carrier diffusion, a 40nm-resolution was demonstratedallowing isolated collagen tissue CL analysis. Distinction of spectralsignatures of two different Extra-Cellular Matrix (ECM) networks had beenperformed. This reveals how CL can track differences in proteins distributionand monitor cell-modelling process by revealing the modifications alongisolated ECM matrix.
Introduction
One of the main challenges in the life sciences is gaining a deeper understanding of complex biological structures. To achieve this, a non-destructive, label-free, and nanometer-scale spatial analysis tool is required. However, no such tool is currently available on the market. By combining the nanometric spatial resolution of an electron beam with the simultaneous spectroscopic analysis of materials, Cathodoluminescence (CL) emerges as a new and innovative way to meet these specific requirements.
This application note illustrates how CL uncovered differences in protein distribution within complex and heterogeneous biomaterials.
Experimental Part
CL analyses were performed on bovine collagen gels prepared from a 5 mg/ml stock of liquid bovine type I collagen and on compressed rat collagen sheets laminated with fibrin (CFC gel). Samples were fixed in 4% PFA and embedded in paraffin. 80 µm-thick sections were placed on clear silicon substrates, then deparaffinized using xylene solvent and finally sputtered with a 3–4 nm thin Au-Pd layer to prevent surface charging.
CL-SEM analyses were performed at 8 keV acceleration voltage, 10 nA probe current, and at room temperature. CL hyperspectral maps were recorded with a 43.2 nm pixel size, achieved by focusing a ~4 nm tight beam. Data were recorded at 20 ms/pixel, providing sufficient signal-to-noise ratio (SNR). Post-processing was performed using Attomap software.
More details on the sample preparation and CL analyses can be found in the published paper.
Results: Spectrally Resolved CL
Due to their fragility and sensitivity to vacuum and e-beam irradiation, biological samples are difficult to analyze under such conditions. Additionally, CL analyses of organic and biological materials are challenging because of their very low light emission after electronic excitation. Thanks to the high optical collection efficiency offered by the integrated reflective objective in Attolight systems, CL signals were successfully detected from the studied samples.
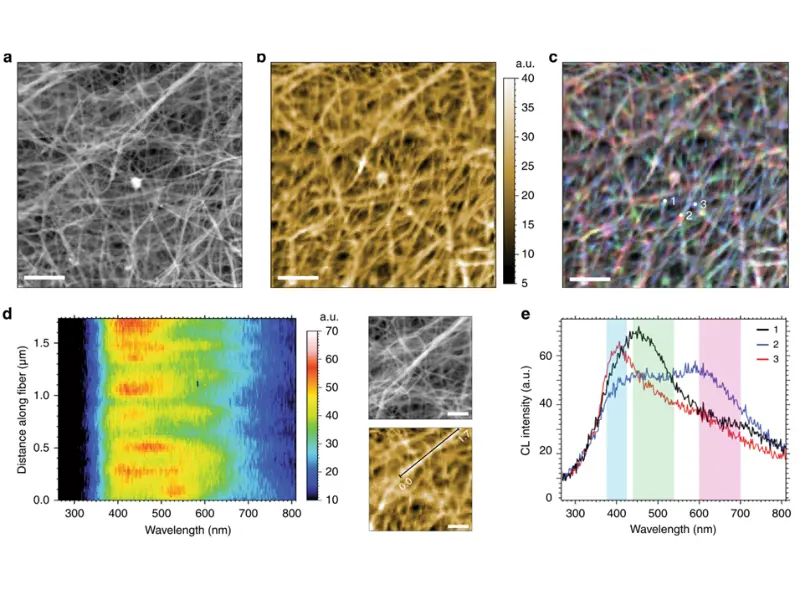
SEM examination of the surface morphology revealed nanometer-sized isolated extracellular fibrils (Fig. 1a). The highly efficient optical collection enabled label-free auto-CL hyperspectral imaging with a 550 nm spectral bandwidth (Fig. 1b) and at three monochromatic wavelengths (overlay of RGB components: 400/490/650 nm; Fig. 1c). These CL images, in good correlation with the SEM image, revealed complex spectral information from individual fibers.
To our knowledge, this is the first time a technique has enabled access to nanometric hyperspectral information within a complex biological sample network.
Figure 1c reveals the heterogeneity of molecular composition within the material. Figure 1e shows the different CL emissions from three distinct locations on the sample.
The 2D projection of the CL signal evolution along a collagen fibril is shown in Fig. 2d. Each pixel row was recorded every 43.2 nm along the selected fibril (1.73 µm distance, marked in the zoomed SE and auto-CL images). Clear spectral evolution along the fiber demonstrates very short carrier diffusion lengths in this type of bio-organic material. In addition, the high spatial precision enables precise spectral analysis and, thus, the clear identification of molecular composition variations.
CL Characterization of Engineered Collagen-Fibrin-Collagen Gel
Human smooth muscle cells (hSMCs) were added during the gelation phase of the collagen and then cultured for 2–4 weeks. A decellularization treatment was performed to create humanized CFC (collagen-fibrin-collagen) gels.
While the presence of fibrin layers within the CFC gel is not visible in the SE image (Fig. 2c), a blue-shifted auto-CL emission in the CL spectra clearly reveals their presence (Fig. 2b). Fibrin CL emission was also detected on the left-side facet of the CFC gel, visible in Fig. 2c as a side wall of the cross-section in the bottom left corner of the SE image.
This thin fibrin layer is present due to the expansion of excess fibrin in a mold during the CFC gel lamination process. Identifying such a thin coating on a topographically similar collagen surface would not be possible using SEM alone without CL.
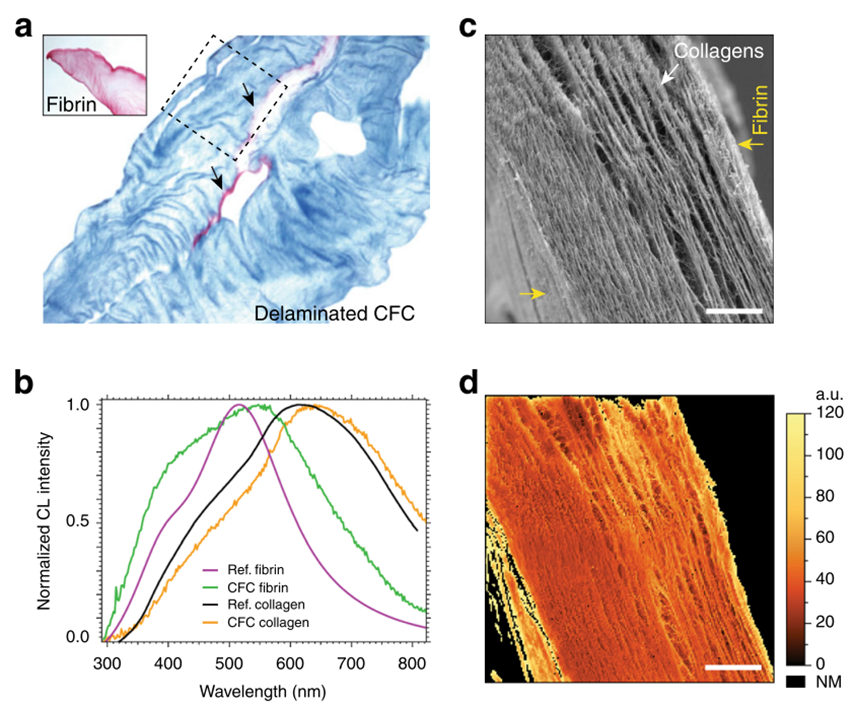
Figure 2b shows a slight spectral shift and a difference in full width at half maximum (FWHM) between the black and orange curves. These changes indicate increased heterogeneity in the sample. The green curve refers to the CL signal from fibril sites. Compared to the reference spectrum (purple curve), the CFC fibrin curve (green) shows a slight red shift and higher FWHM, suggesting a more complex molecular composition, likely due to diffusion at the collagen–fibrin interface during the CFC preparation process.
Conclusion
The capability of spectrally resolved CL microscopy to identify and localize ECM protein complexes has been demonstrated. To our knowledge, this is the first time label-free CL imaging has been performed on such a complex biological sample.
Thanks to the small beam size (~4 nm) and high optical collection efficiency, Attolight tools were able to detect and provide new insights into material composition across a 180 µm field of view (with a maximum CL mode FOV of up to 300 µm), all with lateral resolution on the nanometer scale.
Quantitative intrinsic auto-cathodoluminescence can resolve spectral signatures of tissue-isolated collagen extracellular matrix, M.S. Zielinski, E.Vardar, G. Vythilingam, E-M. Engelhardt, J. A. Hubbell, P. Frey, H.M. Larsson, Nature Communications Biology (2019) 2:69
Open Access publication: https://www.nature.com/articles/s42003-019-0313-x

More applications
Identifying Atomic-Scale Defects Responsible for Blue Emission in hBN Using Correlative STEM-CL

Quantitative CL Uniquely Resolves Individual Point Defects in InGaN/GaN Quantum Wells, Solving Efficiency Gain Riddle
CL from Beam-Sensitive Optoelectronic Materials - Hybrid Halide Perovskites
Applications on Defect Visualization and Counting in Optoelectronic Materials
Applications on Semiconducting Diamond
